There are many web-based environments for creative coding, but p5.js is especially useful for prototyping and 2D work. It is a JavaScript library built on top of Canvas 2D. This article covers p5.js’s strengths, introduces useful functions through a sample sketch, and explains how to publish work created with it.
What is p5.js?
p5.js is a JavaScript library for creating graphics on the web, and one of its biggest strengths is how easily anyone with basic programming knowledge can start creating with it.
The web editor available on p5js.org makes it possible to start creative coding in the browser without any local setup. Even a few dozen lines of code can produce results that feel like media art. The following walkthrough uses the p5.js Web Editor to create a simple animation.
Using the p5.js Web Editor
When you open the p5.js Web Editor, you see a web IDE divided into a text editor containing the JavaScript functions setup() and draw(), and a Preview pane. The editor has many features, but this article focuses on four areas: (1) the text editor, (2) the Preview, (3) the Run button, and (4) Auto-refresh.
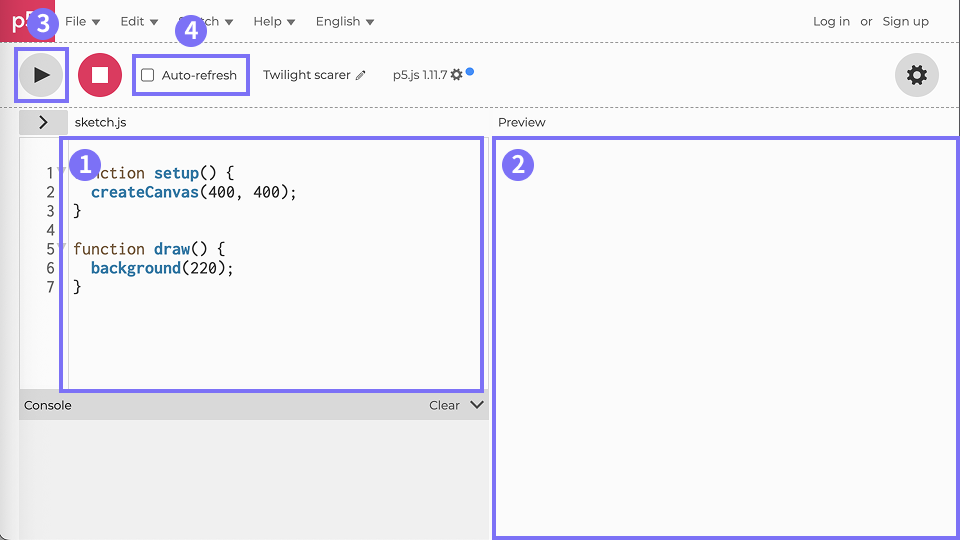
The basic workflow is to write code in the text editor (1), click Run (3), check the result in the Preview (2), and revise as needed.
In p5.js, setup() handles drawing-related configuration and initialization, while draw() handles rendering shapes and updating data. setup() runs only once when the program starts, and draw() keeps running repeatedly. Put one-time work in setup(), such as setting the canvas size, choosing colors, and deciding how often draw() runs. Put the parts that need continuous updates for animation, such as changing coordinates over time, inside draw().
Turning on the Auto-refresh checkbox (4) updates the Preview automatically whenever the program changes, without needing to press Run. On the other hand, because draw() behaves like an infinite loop, programs with a heavy computational load can become slow. When starting out, it is best to keep Auto-refresh turned off.
With the basics in place, the next step is to build an example sketch of randomly moving points connected by lines and use it to better understand how p5.js works.
Example: randomly moving points connected by lines
The goal is the animation below. It shows 100 white points moving at random speeds, with white lines appearing whenever two points come close to each other. The sketch will be built in five steps.
1. Define the variables
Start by defining variables used throughout the program. Variables that need to be available across the whole sketch are declared outside setup() and draw(). In this example, define the number of points, the distance threshold for drawing a line between two points, and the array used to manage the points.
/* Define variables */
const NUM_POINTS = 100;
const MAX_LINE_DIST = 100;
const points = [];
The number of points and the distance threshold for drawing lines could be written directly inside setup() or draw(), but placing them outside the functions makes them easier to adjust later.
2. Initialize the canvas
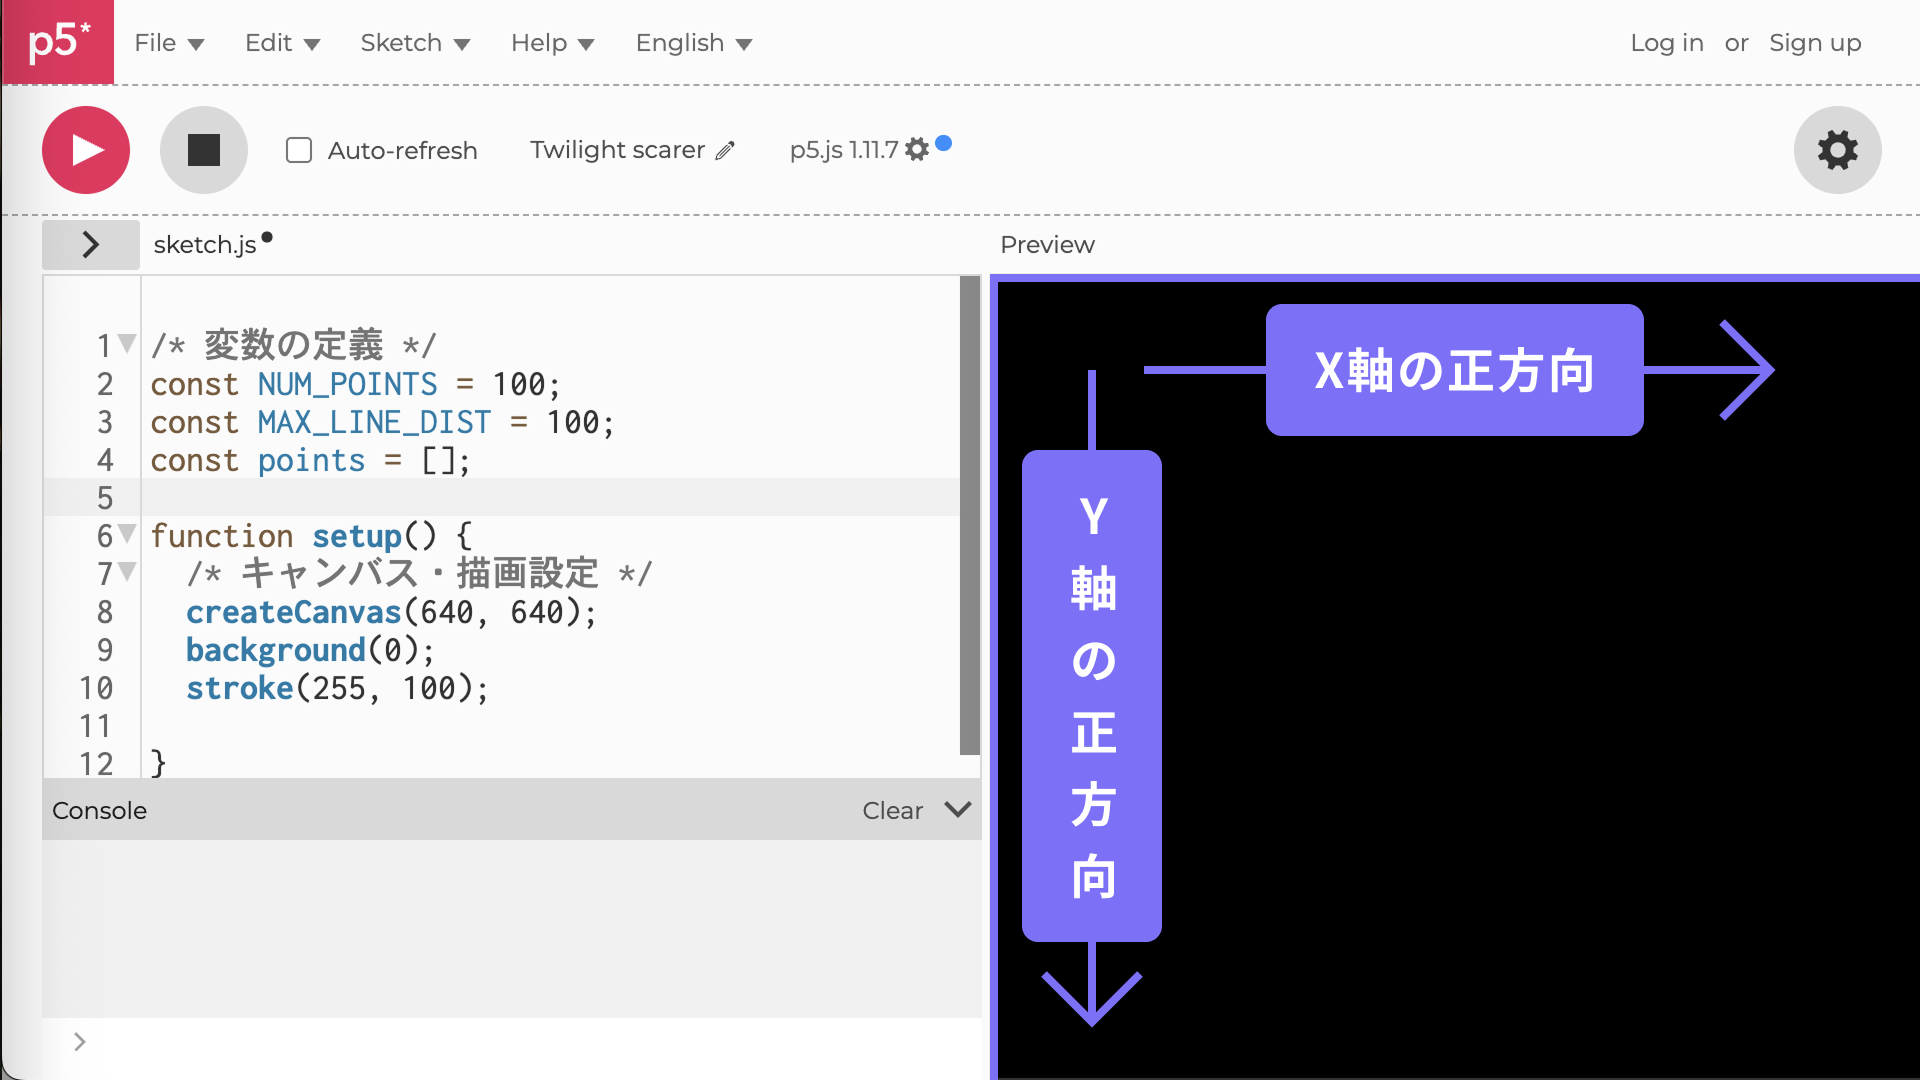
Next, configure the canvas that will hold the drawing and set the colors used for the shapes. createCanvas() creates a drawing area of 640px by 640px, and the stroke color is set with stroke().
function setup() {
  /* Canvas and drawing settings */
  createCanvas(640, 640);
  stroke(255, 100);
}
p5.js provides several color-related functions besides stroke(), including fill() and background(). There are multiple ways to specify colors, but a useful rule of thumb is this: one integer argument means grayscale, and three integer arguments mean RGB.
This example uses stroke(255, 100). When two integer arguments are passed, the first is a grayscale value from 0 to 255, and the second is an alpha value on the same 0 to 255 scale. That means stroke(255, 100) is white with some transparency.
Likewise, when four integer arguments are passed, the first three specify the R, G, and B values on a 0 to 255 scale, and the fourth specifies alpha.
If the sketch is run at this stage, the result is a completely black 640px by 640px canvas. One important detail is that in a p5.js canvas, the positive direction of the y-axis points downward. In other words, larger y values draw lower on the canvas, and smaller y values draw higher.
3. Initialize the points
Next, initialize the array of points to draw. Because each point moves on a 2D plane, define x and y for its position, and vx and vy for its velocity in each direction. For example, to place a point in the center of the canvas and move it to the right, give it the following properties.
const point = {
  x: 320,
  y: 320,
  vx: 1,
  vy: 0,
};
This example needs 100 points moving around the canvas at different speeds, so use random(), the p5.js function for random numbers to place them at random positions and give them random velocities. In p5.js, random() returns a random floating-point number between 0 and the given argument. For example, random(4) returns a number greater than or equal to 0 and less than 4. When two arguments are passed, as in random(a, b), it returns a number greater than or equal to a and less than b. The width and height defined by createCanvas() are automatically stored in the variables width and height. That makes it possible to create a point like this.
const point = {
  x: random(width),
  y: random(height),
  vx: random(-1, 1),
  vy: random(-1, 1),
};
Finally, store 100 point objects like this in the points array prepared earlier.
function setup() {
  /* Omitted */
  for (let i = 0; i < NUM_POINTS; i++) {
    /* Initialize the points */
    const point = {
      x: random(width),
      y: random(height),
      vx: random(-1, 1),
      vy: random(-1, 1),
    };
    points.push(point);
  }
}
4. Update the points
At this stage, the setup for the example is complete. From here on, add drawing and data updates to turn it into an animation. First, inside draw(), update and render the points initialized earlier. Implement the following behavior for each point in points.
- Move each point according to its velocity
- When a point reaches an edge of the canvas, make it bounce back at the same speed
- Draw the point
To apply the same processing to every point in points, iterate over them with a for loop.
For step 1, add the velocity to each coordinate.
For step 2, handle the four canvas edges (x = 0, x = width, y = 0, and y = height). In this example, when a point reaches an edge, its velocity is multiplied by -1 so it starts moving in the opposite direction.
For step 3, use point(x, y), the p5.js function for drawing a point. It draws a point at the specified x and y position. Here, draw the point using the x and y properties stored in each object in points. Also, because draw() runs over and over, the result of the previous frame remains on the canvas, and the whole canvas will eventually fill up with white. To avoid that, call background(0) to reset the canvas to black. Putting those pieces together gives the following code.
function draw() {
  background(0); // Clear the canvas
  for (const p of points) {
    /* 1. Move according to velocity */
    p.x += p.vx;
    p.y += p.vy;

    /* 2. Bounce back at the same speed at the canvas edges */
    if (p.x < 0 || p.x > width) {
      p.vx *= -1;
    }
    if (p.y < 0 || p.y > height) {
      p.vy *= -1;
    }

    /* 3. Draw the point */
    point(p.x, p.y);
  }
}
5. Connect the points with lines
Finally, implement the logic that draws a line whenever the distance between two points is below the threshold. To do that, start by calculating the distance between every pair of points. The following nested for loop checks all possible pairs.
for (let i = 0; i < points.length; i++) {
  for (let j = i + 1; j < points.length; j++) {
    // Use loop variables i and j to check every pair of elements in points
  }
}
Next, calculate the distance between the two points picked by the loop variables i and j. p5.js provides dist(), a function that calculates the distance between two points simply by passing in their coordinates.
dist(points[i].x, points[i].y, points[j].x, points[j].y);
All that remains is to draw a line when the distance is below the threshold. To draw a line, use the p5.js function line(). Like dist(), it takes the coordinates of two points as arguments and draws a straight line between them.
That completes the code for this example. The result can look like a living organism or a constellation, depending on how the independently moving points happen to connect. Because the positions and velocities of the points are determined by random values, the output changes every time it runs.
/* 1. Define variables */
const NUM_POINTS = 100;
const MAX_LINE_DIST = 100;
const points = [];

function setup() {
  /* 2. Initialize the canvas */
  createCanvas(640, 640);
  background(0);
  stroke(255, 100);

  /* 3. Initialize the points */
  for (let i = 0; i < NUM_POINTS; i++) {
    const point = {
      x: random(width),
      y: random(height),
      vx: random(-1, 1),
      vy: random(-1, 1),
    };
    points.push(point);
  }
}

function draw() {
  background(0);

  /* 4. Update the points */
  for (const p of points) {
    p.x += p.vx;
    p.y += p.vy;
    if (p.x < 0 || p.x > width) {
      p.vx *= -1;
    }
    if (p.y < 0 || p.y > height) {
      p.vy *= -1;
    }
    point(p.x, p.y);
  }

  /* 5. Connect the points with lines */
  for (let i = 0; i < points.length; i++) {
    for (let j = i + 1; j < points.length; j++) {
      const d = dist(points[i].x, points[i].y, points[j].x, points[j].y);
      if (d < MAX_LINE_DIST) {
        line(points[i].x, points[i].y, points[j].x, points[j].y);
      }
    }
  }
}
Extending the sketch
The basic example is complete here, but creative coding pieces can take on a completely different look with only small parameter changes. For example, increasing the transparency of the background color and the line color creates a hazy effect.
Also, reducing the threshold for drawing lines while increasing the number and speed of the points creates a more finely textured look.
Even when the underlying logic is the same, small parameter changes can produce a wide range of visuals. That is one of the pleasures of creative coding with p5.js.
Publishing your work and joining the community
The functions introduced in this article are only a small part of what p5.js offers. Browsing the official p5.js Examples page already shows how broad the range of expression can be. Once a sketch is ready, publish it and share it.
- OpenProcessing is a platform for publishing and sharing works made with p5.js. It lets creators get reactions and comments, and learn from other people’s work and source code.
- NEORT is a platform for sharing digital art. It brings together a wide range of work, from pieces made with p5.js, Three.js, and openFrameworks to pieces made with TouchDesigner and video works, without limiting itself to a single tool.
- Processing Community Japan is a Japanese community for creative coding with Processing and p5.js. Joining the community’s Discord server makes it possible not only to share work, but also to ask questions, get help, and learn about events such as exhibitions.
Posting images or videos of your work on X with tags such as #p5.js and #creativecoding is also recommended. People in the community and others interested in creative coding may respond.
Conclusion
This article used a p5.js sketch to introduce how p5.js functions work, the range of visual expression the library supports, and ways to share the results. Because it requires no environment setup and the web editor makes it easy to start creating, creative coding with p5.js is easy to begin right away.
Although this article focused on p5.js, there are also related articles that explain how to approach creative coding in JavaScript without using libraries, as well as articles on generative art algorithms and random numbers. Other articles cover using p5.js with TypeScript and combining it with other libraries. Take a look at those as well.
Related p5.js articles
Related creative coding articles
- Article: JavaScriptで取り組むクリエイティブコーディング パーリンノイズを使いこなせ
- Article: JavaScriptで取り組むクリエイティブコーディング パーティクル表現入門
- Article: CSSとHTML Canvasで作るモーショングラフィック
Related articles on generative art and algorithms
- Article: JavaScriptで始めるジェネラティブアート 生物アルゴリズムの応用
- Article: スクリプト要らずで実現!Unityで作る超簡単ジェネラティブアート
- Article: JavaScript開発に役立つ 重要なランダムの数式まとめ
Additional resources
For a more structured way to learn p5.js or broaden the range of work you can make, the following sites and books are useful.