Debugging JavaScript is one of the essential skills in web development. By debugging a program while it runs, you can inspect the current values of variables and see how execution is progressing. Debugging helps you analyze whether a program is behaving as intended.
In this article, I explain the basics of debugging JavaScript using the “Developer Tools” in Chrome and Edge browsers (hereafter referred to as “Developer Tools,” often abbreviated as “DevTools”). It is written in tutorial form so that even people who have never used Developer Tools before can follow along. It is organized so you can understand it in about 20 minutes, so read through it in order while trying each step.
What you will learn in this article
- How to use Developer Tools
- How to use breakpoints in JavaScript
- How to inspect the state of variables while a program is running
- How to step through a program
Debugging is a technique you should absolutely know when learning programming. What is introduced in this article is useful not only for JavaScript, but for many other programming languages as well.
Sample used in this article
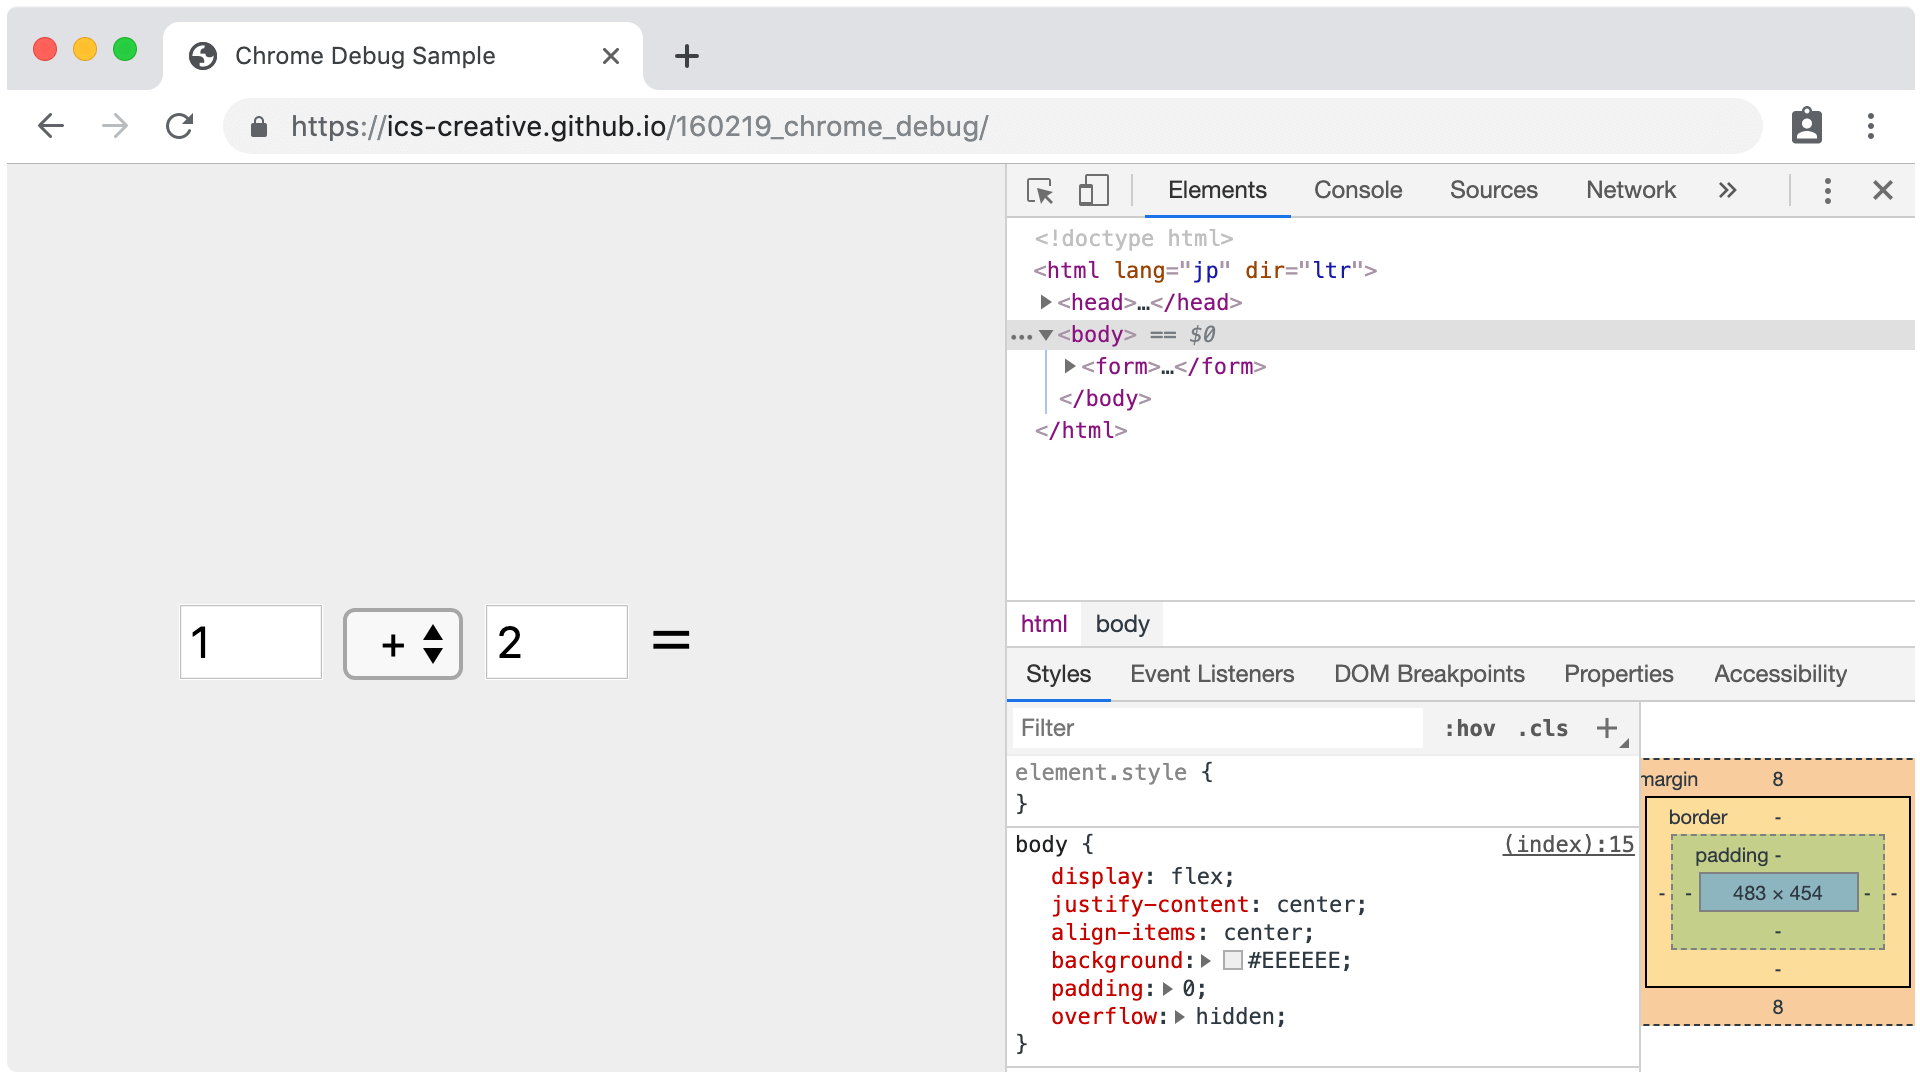
In this article, we will debug a JS program using a sample. Open the demo in a new window before continuing.
▲ This is a JavaScript sample that calculates the two numbers entered in the form using the method selected in the dropdown.
Note: This article has been tested with Chrome 135, the latest version as of April 2025. The DevTools screenshots are shown in English.
Note: The screenshots in this article use Chrome, but the same operations are available in Edge.
Opening Developer Tools
Open a website in Chrome, then select [Right-click] → [Inspect] to display Developer Tools. The shortcut key is F12 (on macOS, Command + Option + I).
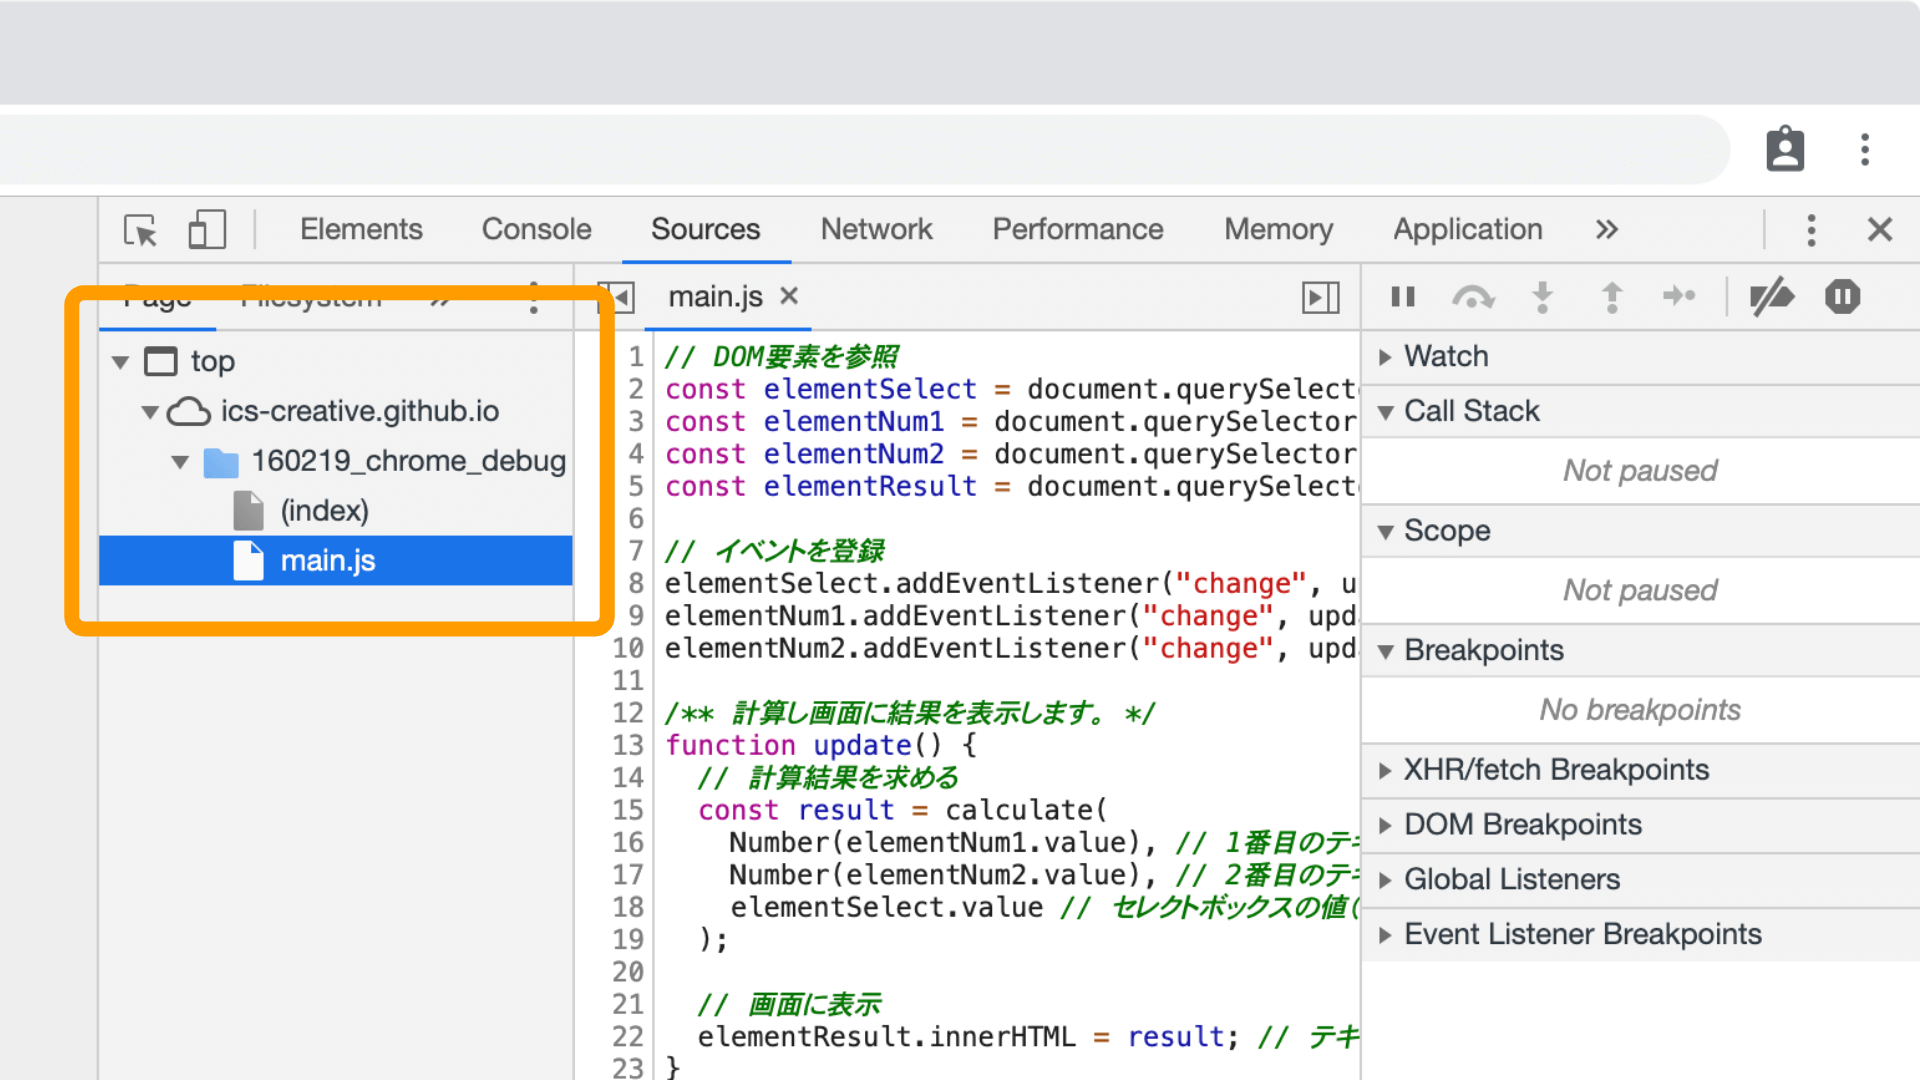
First, select the [Sources] tab to open a JavaScript (.js) file.
![Screenshot: Open Chrome’s [Sources] tab](/entry/190517/images/190517_chrome_debug_01.png)
From the [Sources] → [Page] tree on the left side of the screen, select the target JS file. The contents of the selected file will then appear in the main area. As an example, open the link below, display Developer Tools, and show the JavaScript file named main.js that is loaded in the browser.
Setting breakpoints
A breakpoint is a feature that stops execution at any line while a program is running. Using this feature, you can inspect the current state of the variables being used.
Set a breakpoint
Click the line number in the source code shown in the main area. A blue arrow will appear, indicating that a breakpoint has been set. When program execution reaches that line, it will pause temporarily. Click the blue arrow again to remove the breakpoint.
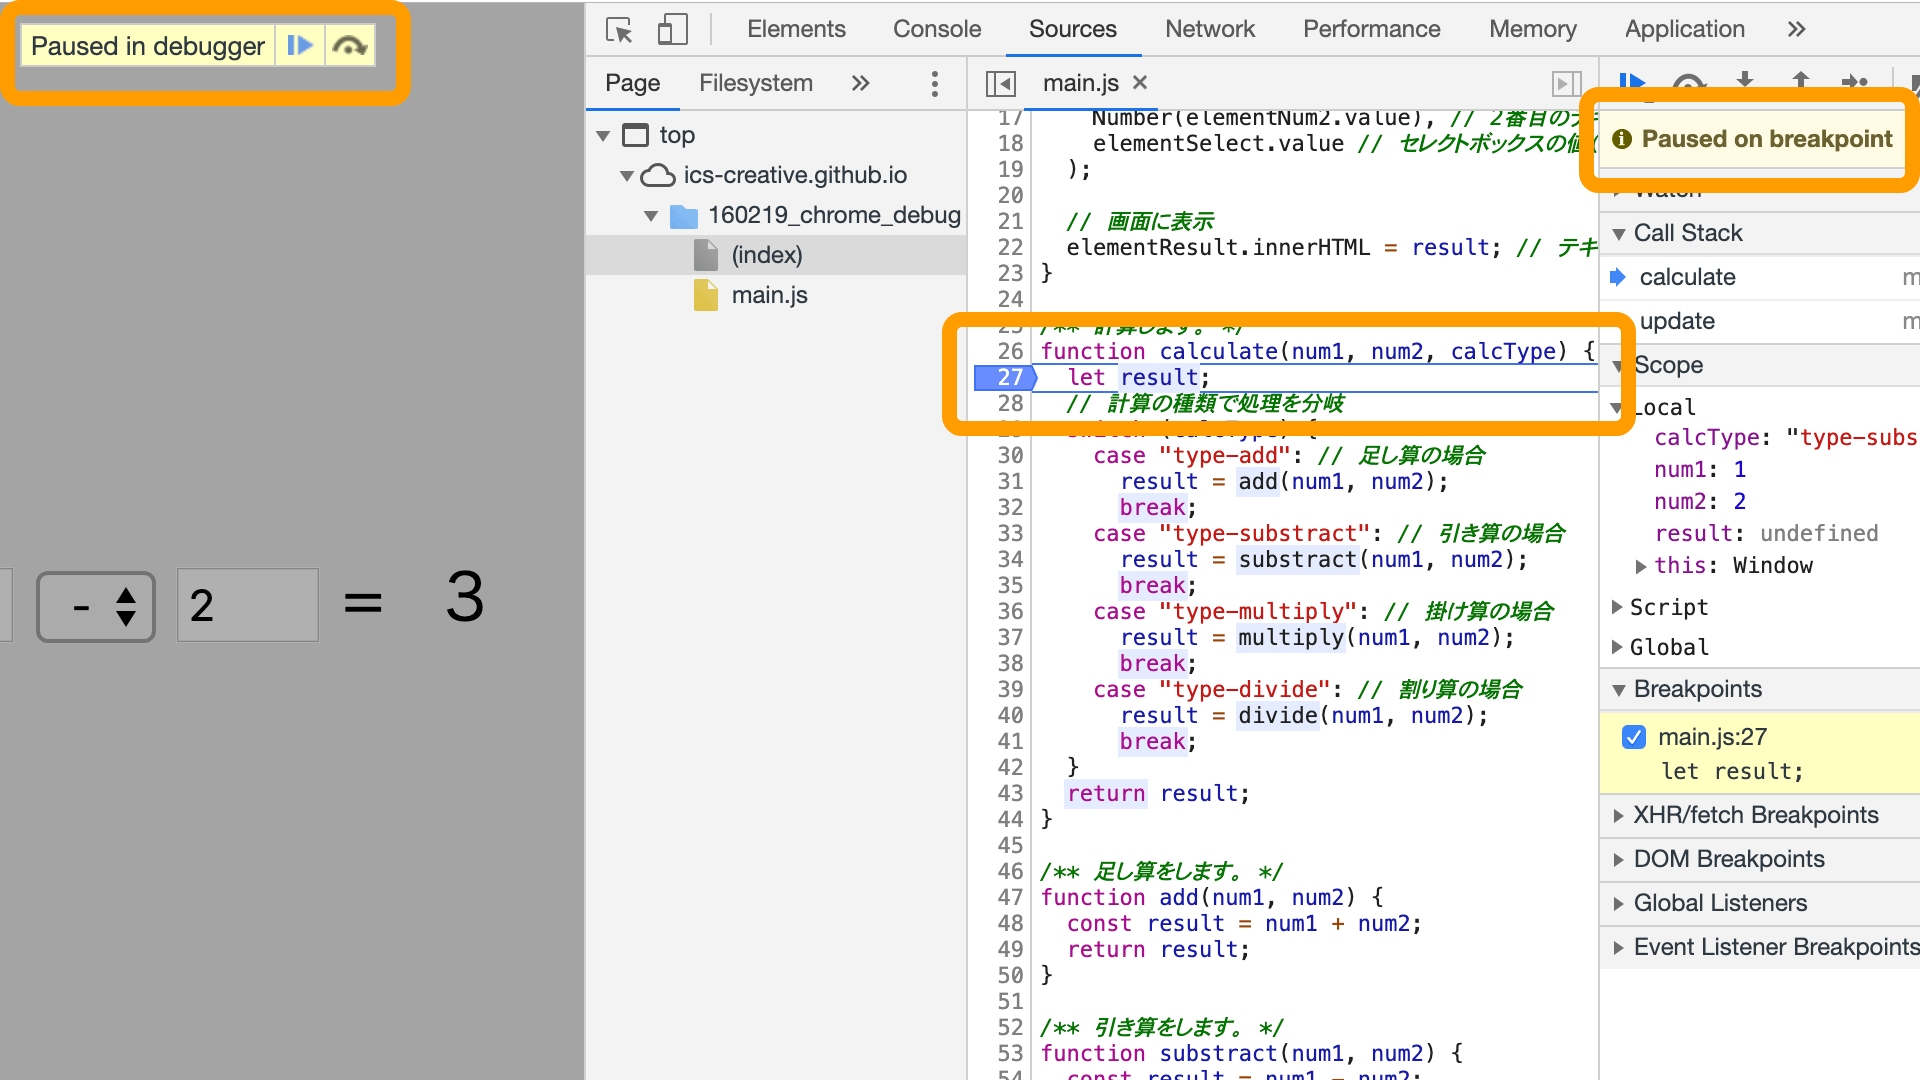
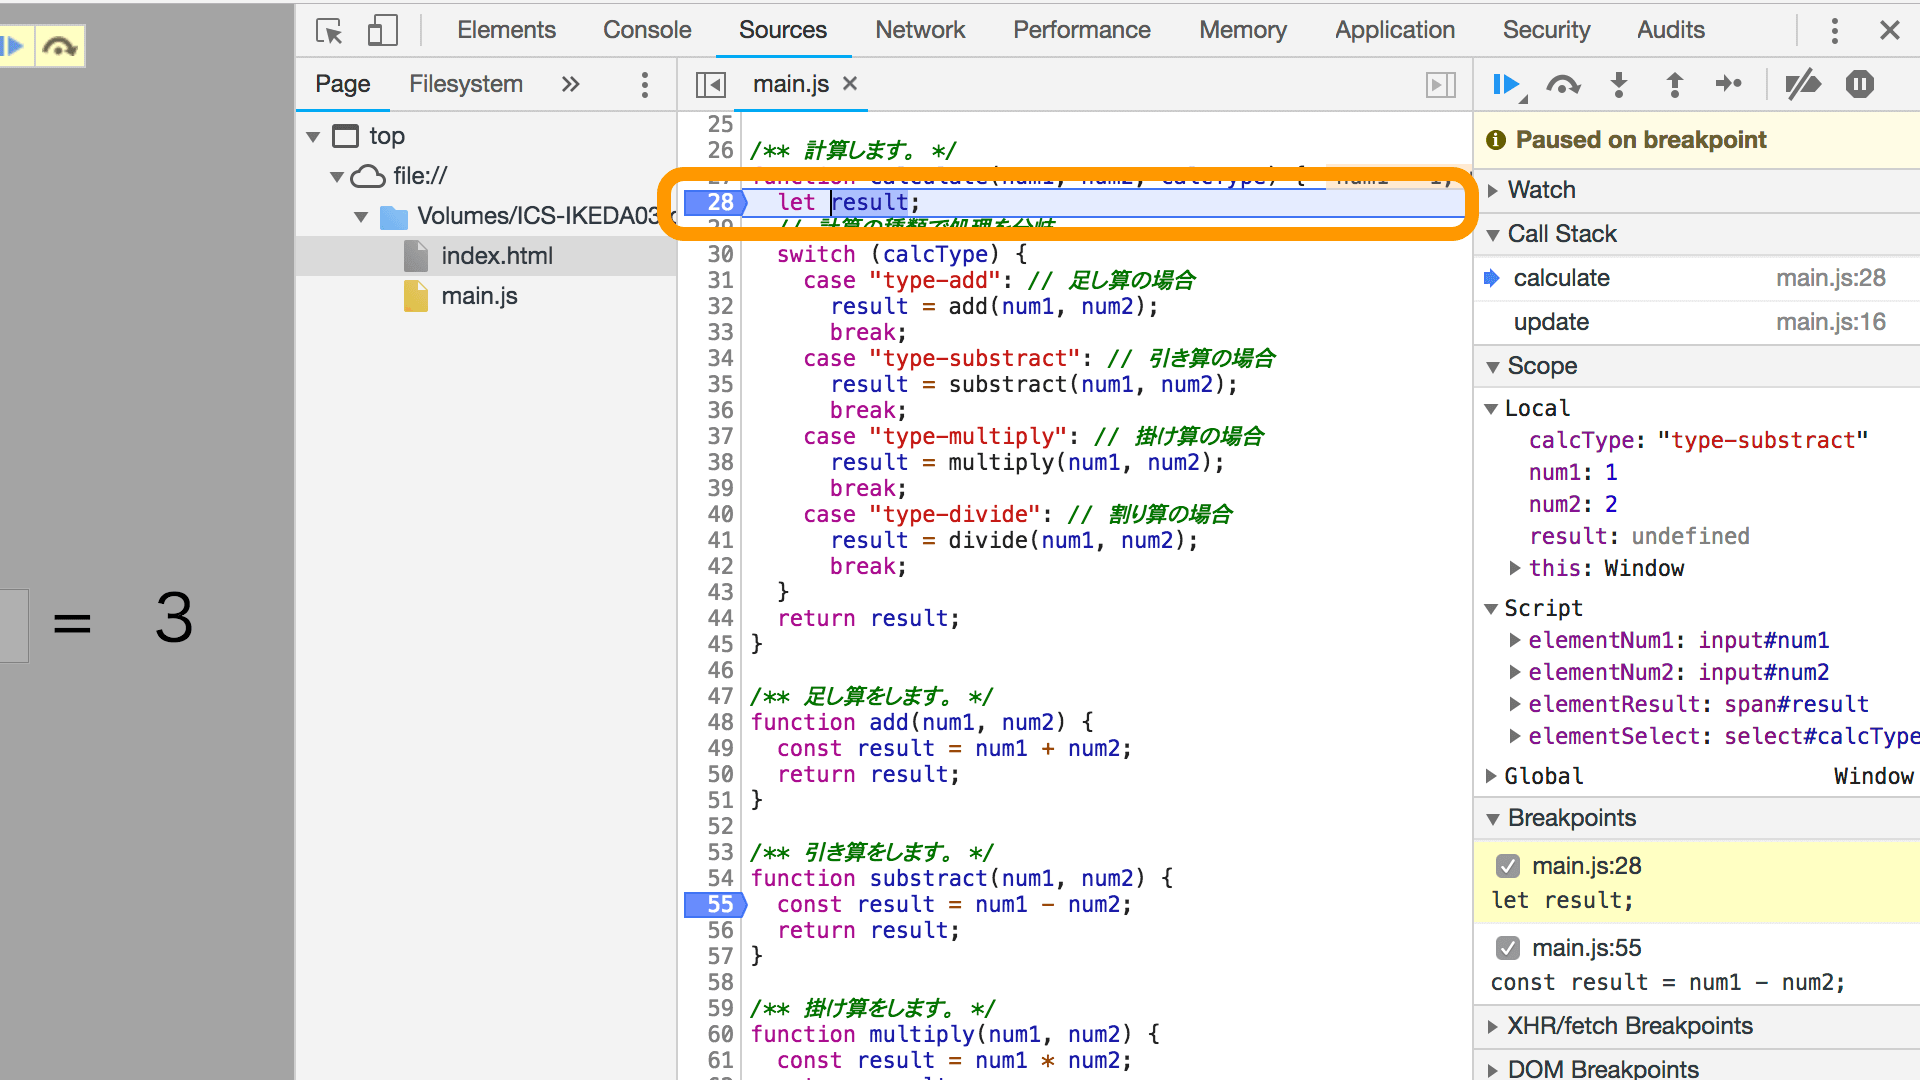
As a quick test, set a breakpoint on line 27 of the source code you opened earlier (the let result line), then select - (subtraction) from the sample dropdown.

Execution will then pause at the breakpoint.
You can set multiple breakpoints
You can set multiple breakpoints, and all of them are listed in the [Breakpoints] panel on the right side of the screen. Each breakpoint shown in the panel has two lines of information: the first line shows the source file name and line number, and the second line shows the source code on that line.

Clicking the first line clears the checkbox for that breakpoint. When unchecked, that breakpoint is temporarily disabled, and execution will no longer stop even if the program passes through that line.
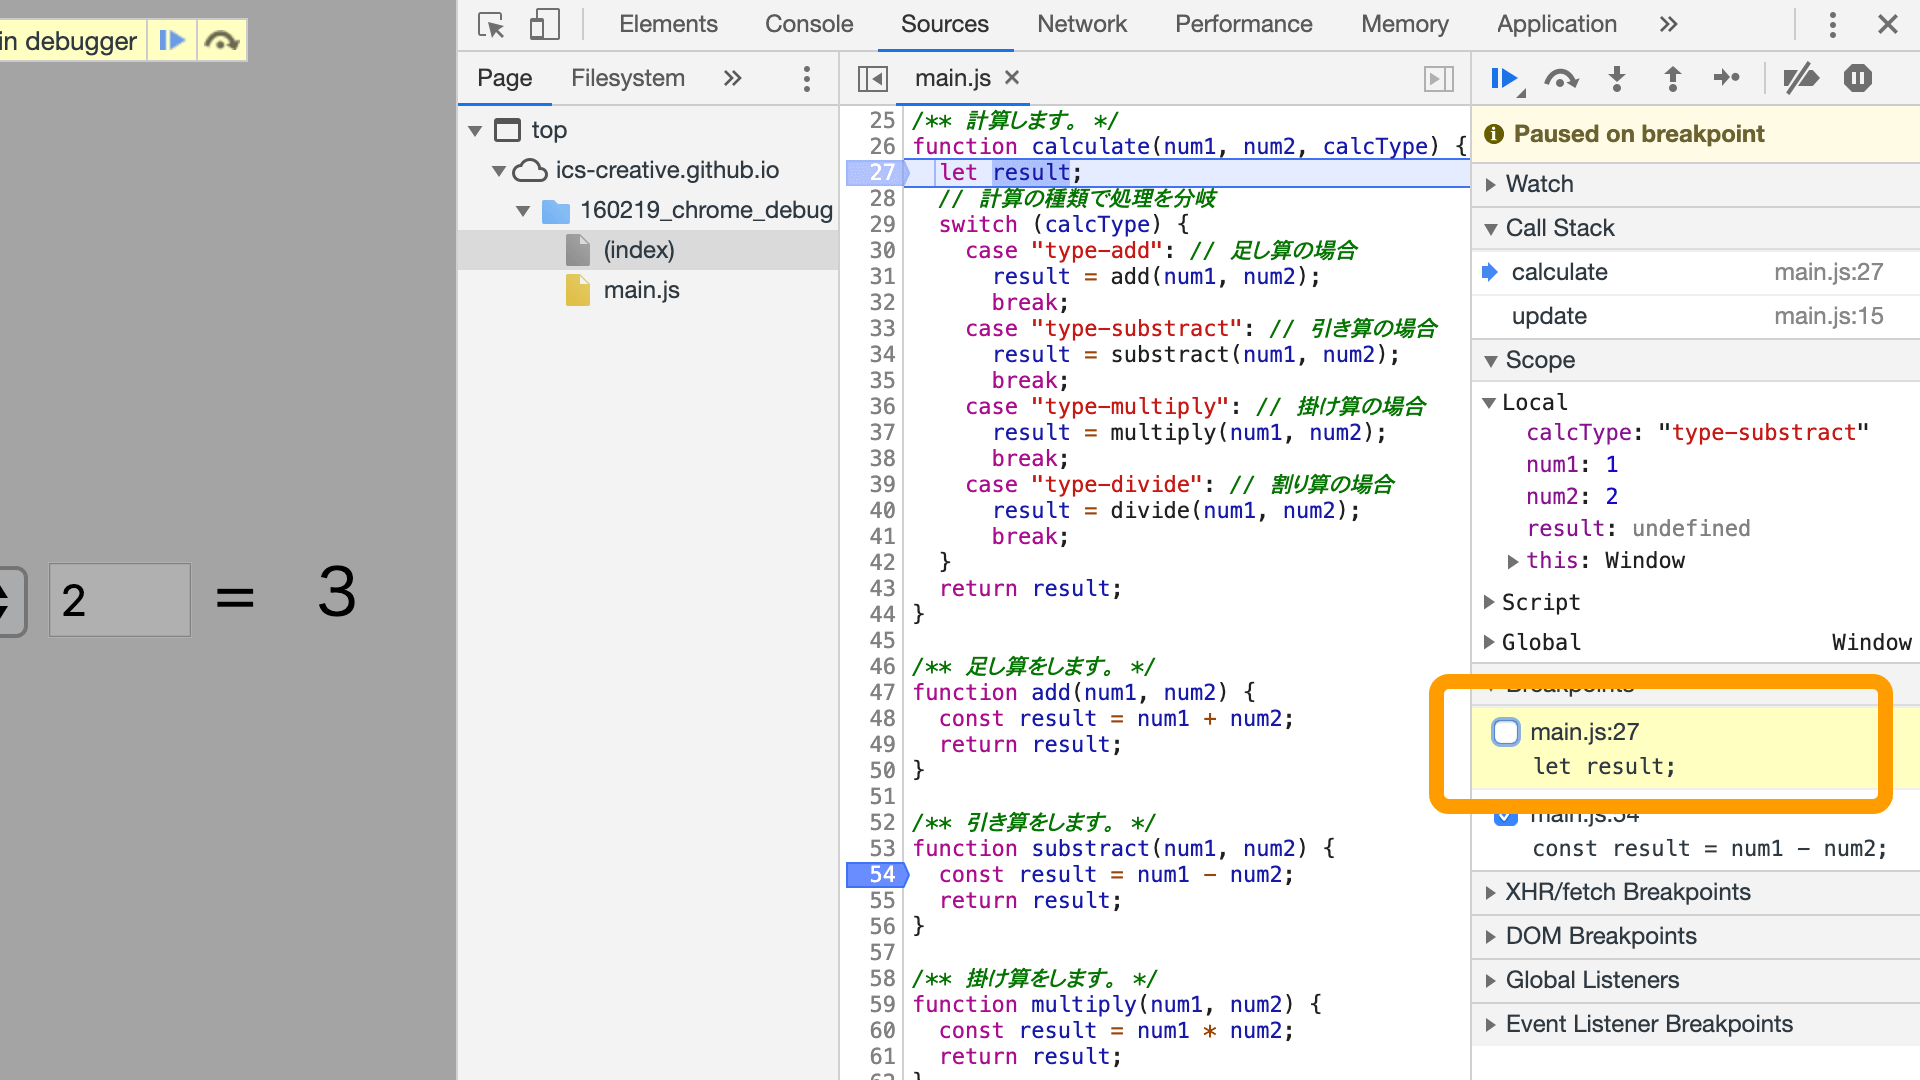
Clicking the second line highlights the corresponding line in the main area. This is convenient because you can jump directly to the place you want from the [Breakpoints] panel.
Checking variables
When you stop program execution at a breakpoint, you can inspect the current values of variables in the program.
You may have been writing console.log() or alert() in your source code when you wanted to check the value of a variable. By using breakpoints, you can inspect any variable in the browser without editing the source code.
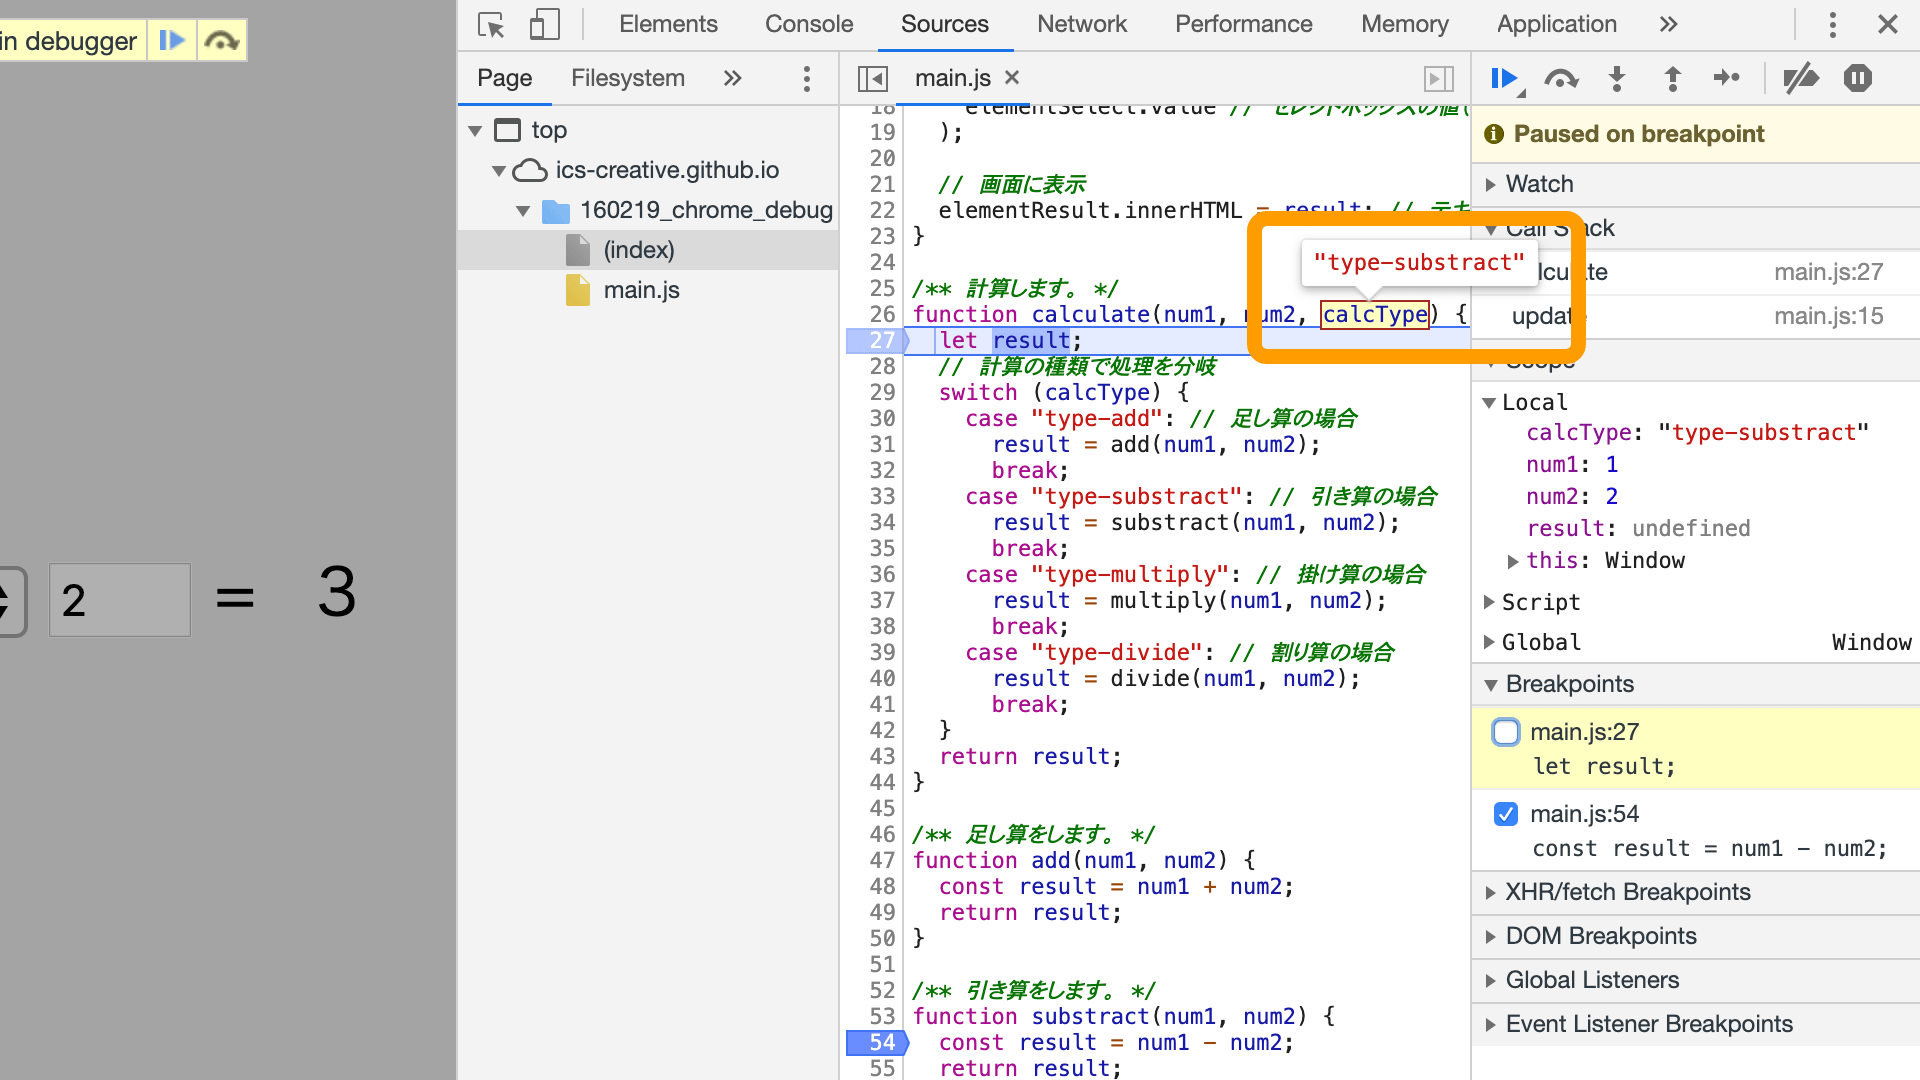
Hover over a variable to inspect its value
You can inspect a variable’s value by placing the mouse pointer over it. For simple information such as numbers and strings, this quick display is usually sufficient.
View the values of variables in the current scope as a list
If you want to inspect the details of a complex object variable, the [Scope] panel is useful. It shows the variables in the currently executing JavaScript scope. If they are local variables inside a function, they appear in the Local tree.
![Screenshot: Open Chrome’s [Scope] panel](/entry/190517/images/190517_chrome_debug_21.png)
Use Watch for deeply nested variables
If there are many variables used inside a function, or if you want to inspect a variable deep inside an object, use the [Watch] panel. By entering a variable name in the [Watch] panel, you can display and monitor its state. Click the [+] button and enter the name of the variable you want to watch.
![Screenshot: Open Chrome’s [Watch] panel](/entry/190517/images/190517_chrome_debug_22.png)
Stepping through a program
You can continue running a program that has stopped at a breakpoint using the buttons at the top right of the screen. These controls let you inspect the flow of execution.
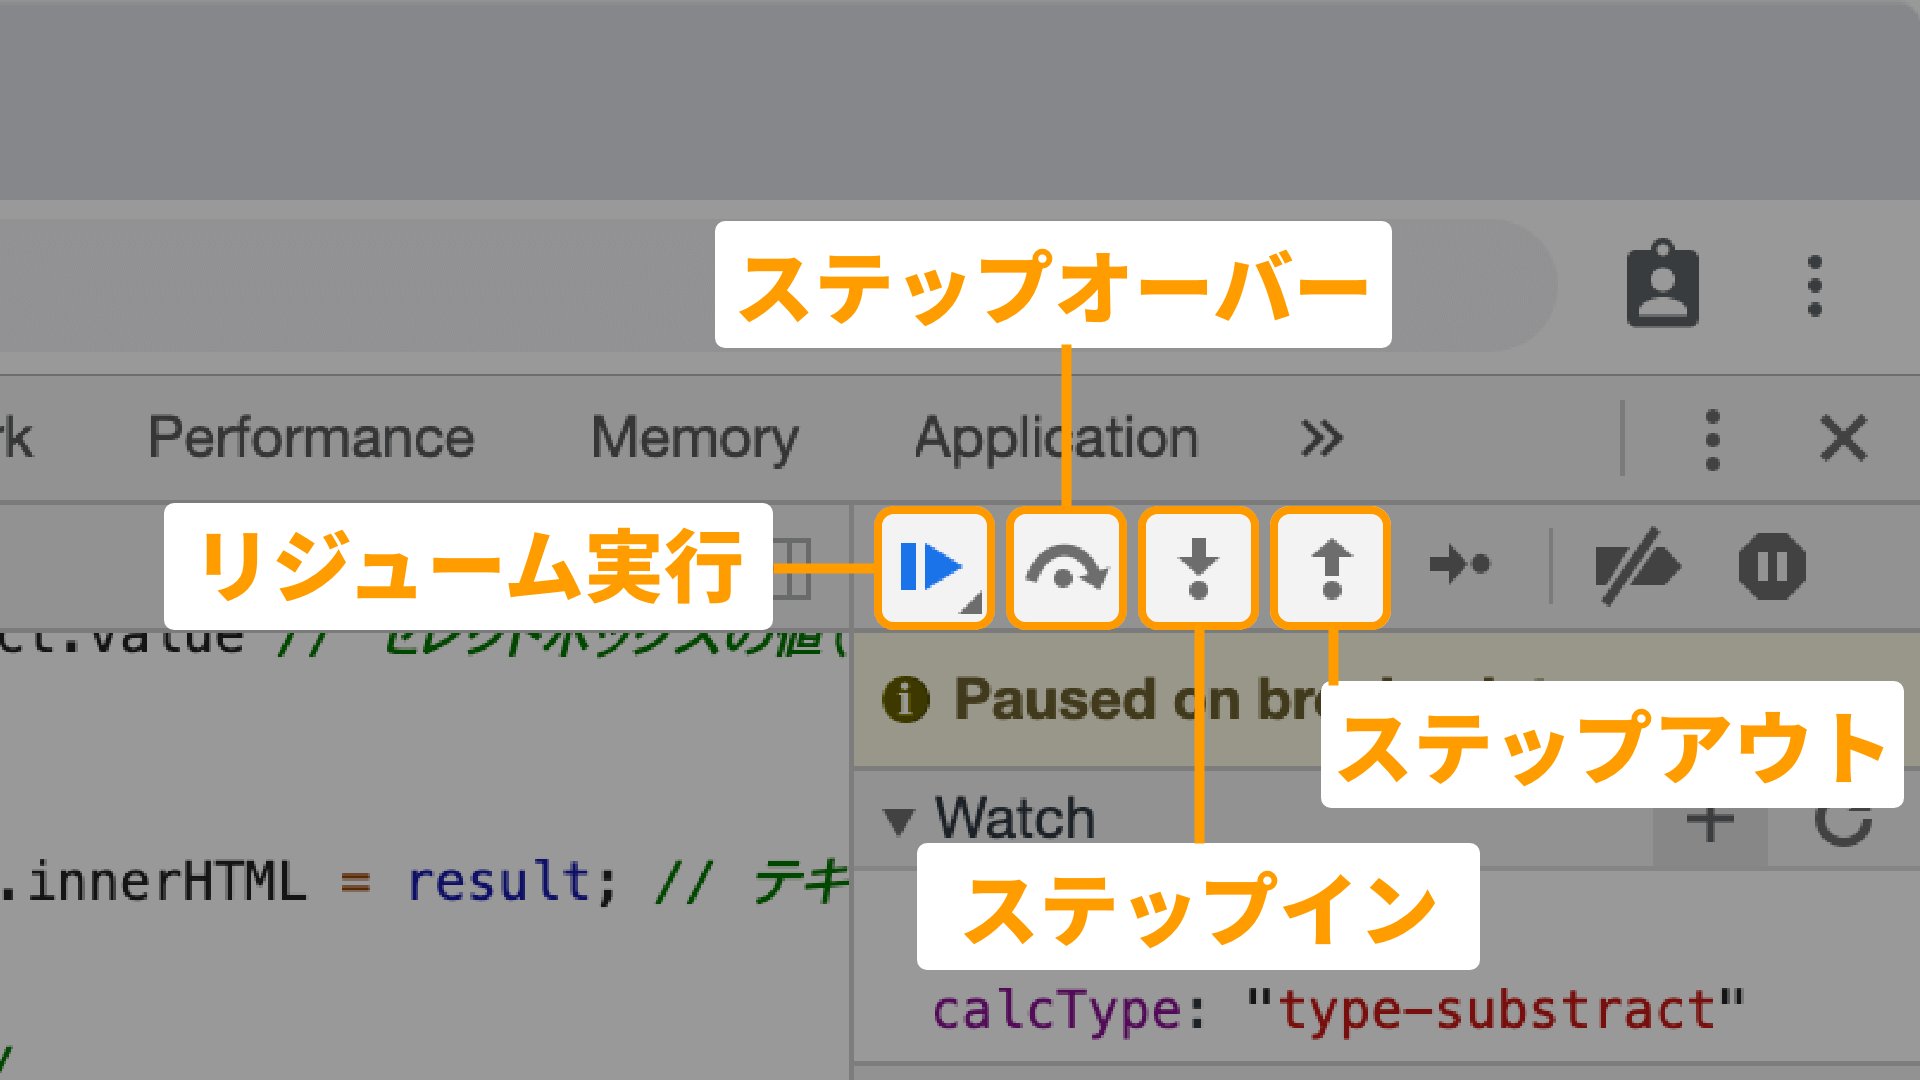
Resume execution
Continues execution of a program that was paused at a breakpoint. By setting multiple breakpoints, you can check whether processing is occurring in the expected order.
Step into
When execution is paused at a breakpoint, the code on that line has not yet been executed. If you use Step into, the current line is executed, then execution moves to the next line to be processed and pauses there again. This lets you inspect the flow of execution one step at a time.
▲ With Step into, you can go into the processing inside the add() function
Step over, step out
While Step into lets you inspect code one line at a time, Step over and Step out are useful for checking the broader flow of execution. If a function is called on the current line, Step over executes all of the processing inside that function and then stops on the next line. Step out executes all remaining processing inside the current function and returns to the line where that function was called.
▲ With Step over, you can skip inspecting the processing inside the add() function
Use step execution to inspect the flow of processing
Let’s use step execution to inspect the actual flow of the program.
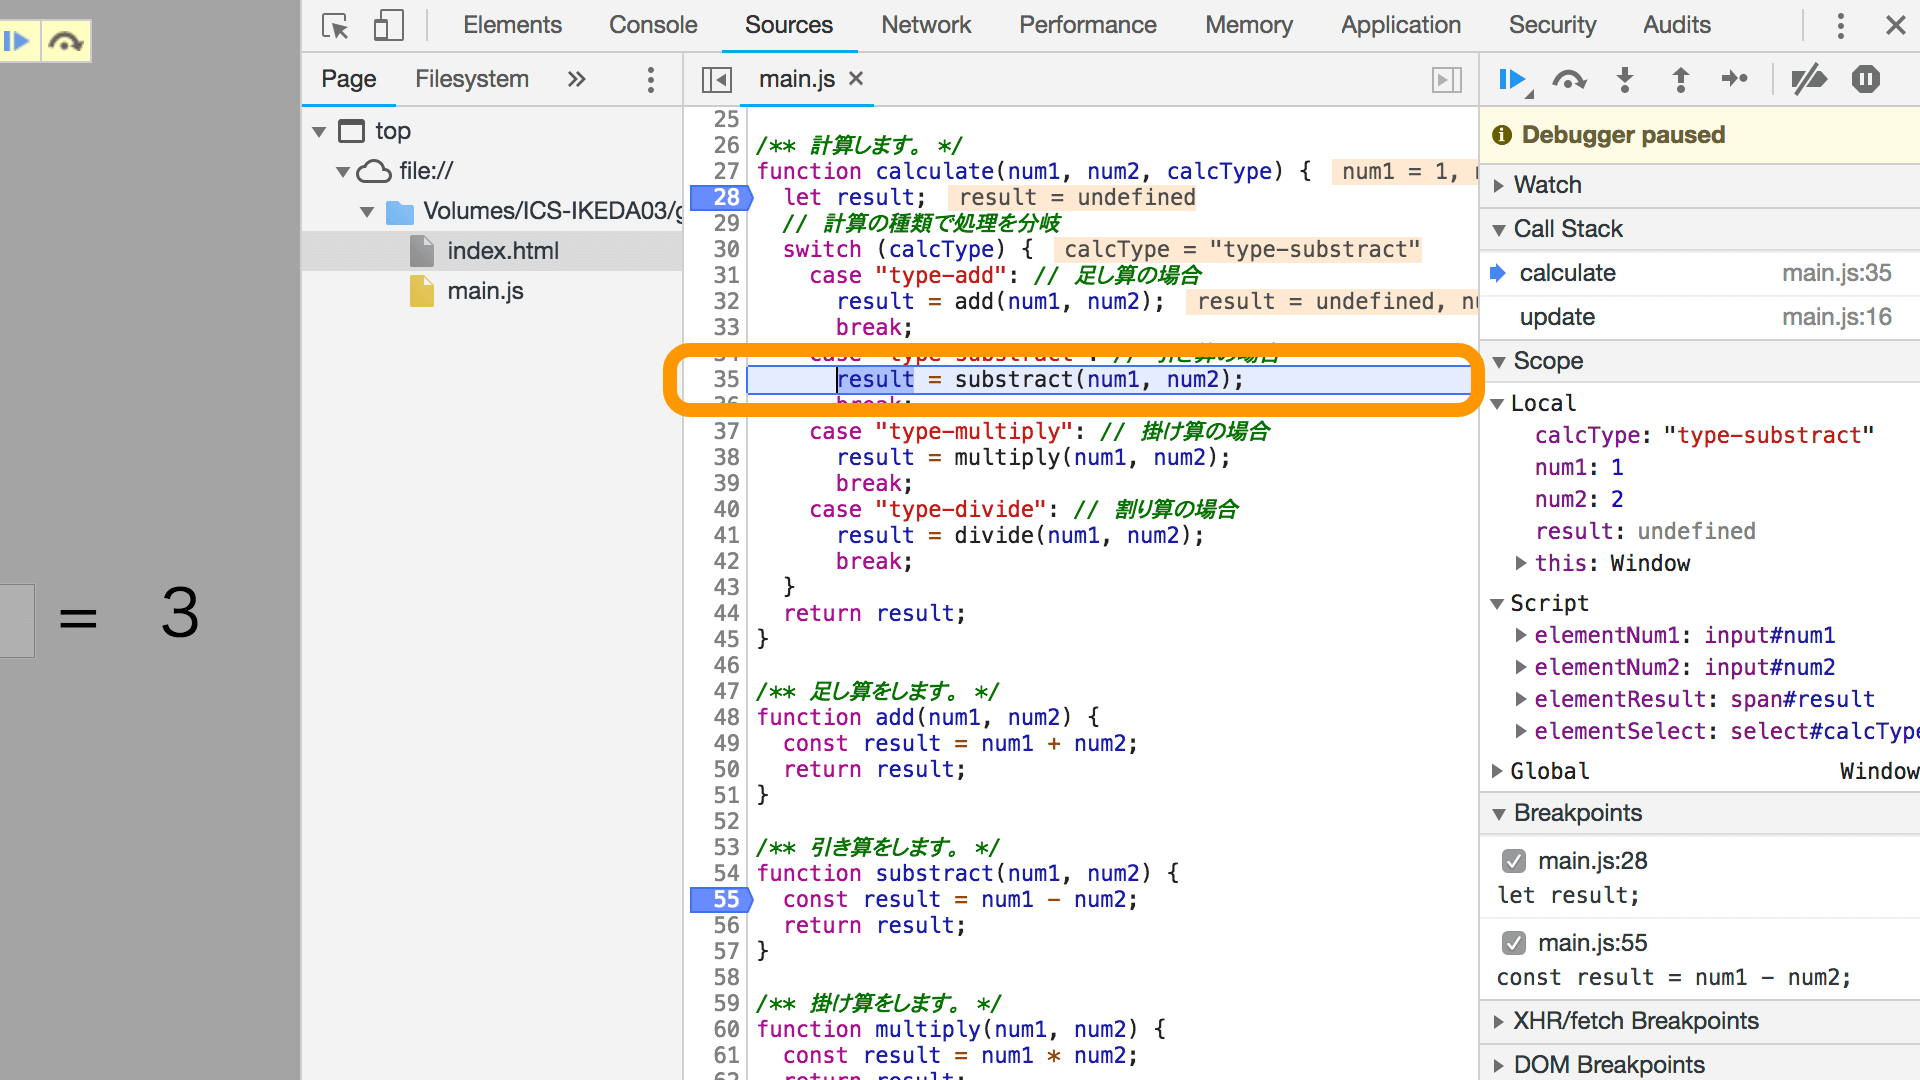
Earlier, the program was paused after setting a breakpoint. First, press the [Step over] button to move execution to the next line. Execution has now moved to the switch statement. If you check the value of calcType in the [Scope] panel, you can see that it is "type-substract". From that, you can predict that execution will next move to case "type-substract".
Press the [Step over] button once more, and as expected, execution moves to case "type-substract". In this way, you can confirm whether the control flow is working as expected by looking at variable values. Next, let’s inspect what processing takes place inside the currently paused substract() function.
If you press [Step over] here, execution moves to the break statement. What we want to inspect this time is the code inside substract(), so use the [Step into] button to move to the next line of processing. Execution jumps into the substract() function, where you can see that num1 - num2 is executed. Since you can also see the values of the function arguments num1 and num2, you can predict what the result variable will become. Press the [Step over] button to continue and inspect result.
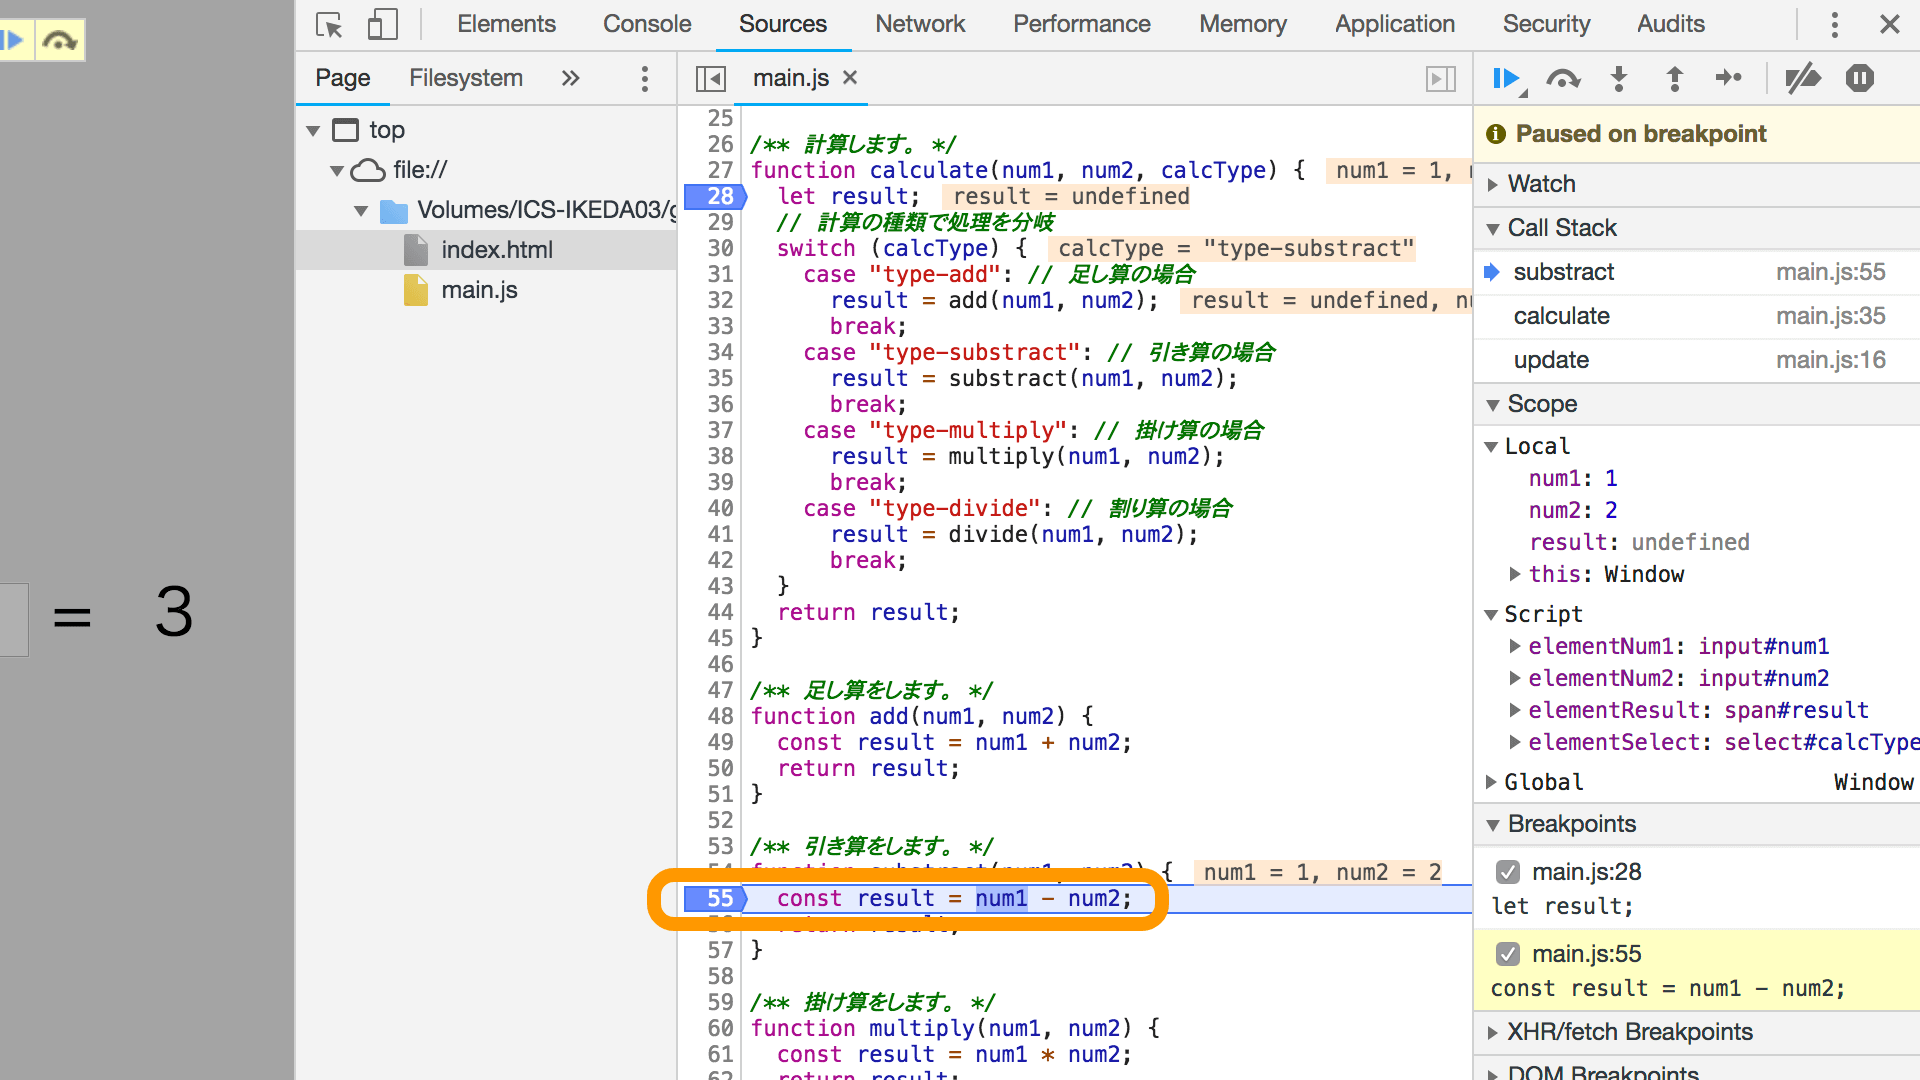
Finally, press the [Step out] button to finish the processing inside substract() and return to the break statement. By pausing execution at breakpoints, checking variables as needed, and making full use of step execution, you can understand why a particular branch is taken in if and switch statements.
Techniques for advanced users
Up to this point, we have covered beginner- and intermediate-level features that JavaScript developers should know. There are also additional debugging features that are useful for advanced users, so let’s look at those as well.
Conditional breakpoints
A conditional breakpoint is a mechanism that activates a breakpoint only when a condition is satisfied. Use it when you want a breakpoint to trigger only under specific conditions.
In this sample, the breakpoint is triggered when the function argument is a number greater than 5.
Logpoints
Logpoints are a mechanism for outputting information to the Console panel. A regular breakpoint pauses code execution, but a logpoint only outputs a log and does not stop execution.
With logpoints, you can use the Console even if you have not written a console.log() method in the development code. They are especially useful when debugging in production environments.
Live Expressions
Live Expressions are useful when you want to monitor the value of a variable continuously.
When doing creative coding, many developers want to continuously monitor a value without filling up the Console panel. This feature is helpful in exactly that situation.
The value of a Live Expression is updated every 250 milliseconds.
Event Listener Breakpoints
Event Listener Breakpoints are effective for debugging web applications with many dynamic interactions. In the [Event listener breakpoints] panel, selecting the events you want to monitor causes a breakpoint to be triggered automatically whenever the corresponding event occurs.
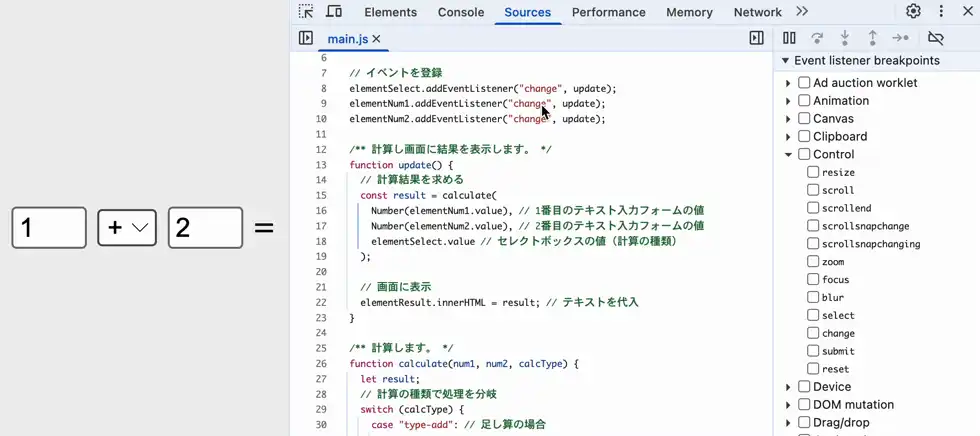
In addition to user actions such as button clicks, scrolling, and keyboard input, you can also easily debug timing such as canvas creation and error events.
Conclusion
Program debugging with breakpoints is also available in many tools for other programming languages, including Xcode, Eclipse, and Visual Studio. So once you learn the concept, it will be extremely useful in your future programming work. Make sure you become comfortable using it.
This is a more advanced topic, but you can also debug JavaScript by linking your editor with Chrome. The following articles explain how to configure this in VS Code and WebStorm. Be sure to check them out as well.